Microsoft Power BI is the Market Leader Business analytics service that lets you visualize your data and share insights. It converts raw data from different sources to interactive dashboards and Business Intelligence reports.
In this occasion we bring you 7 steps to quickly start analyzing and visualizing your Data with Power BI Desktop.
Should you need any help from our Team of Experts via Consulting or Training, book an introductory call right away:
1. Download and installing Power BI Desktop
Getting started with Power BI is completely free, which is great! You can follow the official link here from Microsoft to download and install the latest version of Power BI Desktop on your Local Computer.
2. Connect to your Data
Power BI includes built-in connectors that you can use to connect to a myriad of Data Sources both on-premises (i.e. files residing on your local computer such as excel workbooks, csv, txt, etc) and online (i.e. online services and applications, cloud storage, databases, etc). These connectors offer a secure and seamless access and integration of Data to be analyzed. (See all Connectors here).
Once you are working on Power BI you may find multiple ways to access features. We will focus on the most used, but feel free to use the one that works best for you, since the end result should be the same.
Find the Data Connectors within the Home Ribbon as shown in the picture below:
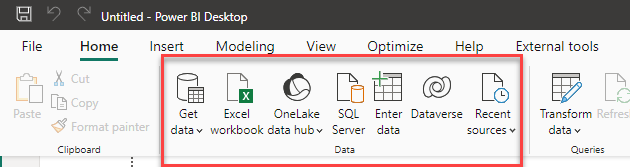
Notice some connectors are recommended with a quick access, you can find more by clicking on “Get Data”.
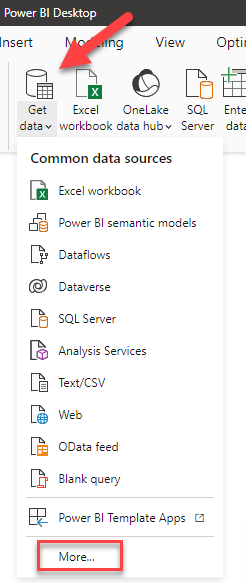
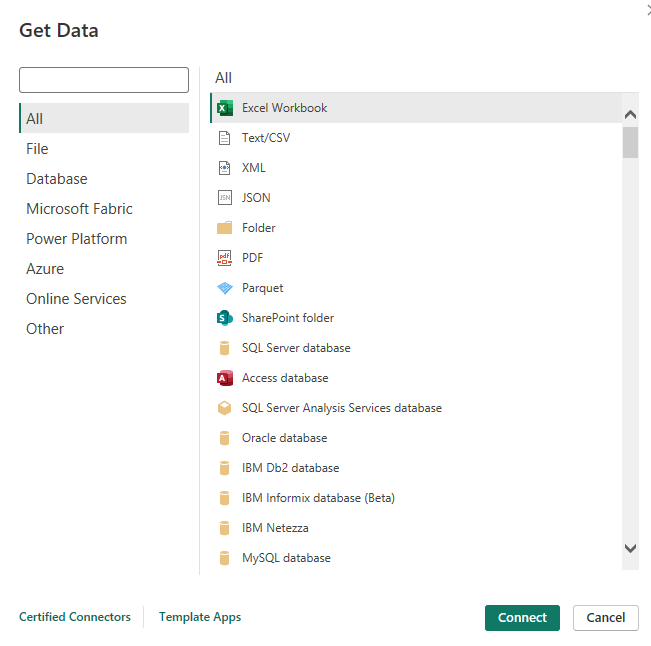
The menu shows again some common data sources, click on More to access all Connectors available. This action will take you to navigate the connectors by category or go through each of them under “All”
3. Shape your Data
Once you connect to your Data, you may choose to start working if its format is correct. In most cases, you need to perform some basic adjustments (such as changing Column Data Types, Column Names, removing columns) to more advanced (merging/appending different tables, functions, creating columns, etc).
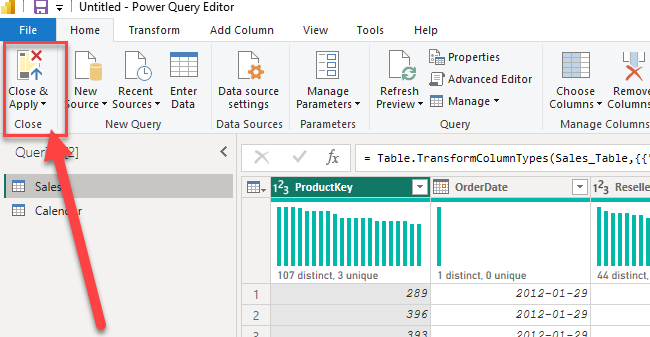
Choose “Transform Data” to access the integrated tool “Power Query” which offers a friendly and intuitive interface to preview your Data and apply all your transformations by using the visual options with simple clicks or using the advanced editor where you can write your code using “M” (mashup) Language.
Once you are done, click on “Close & Apply”, for all the steps to take effect and be loaded into your Local Power BI Data Model.
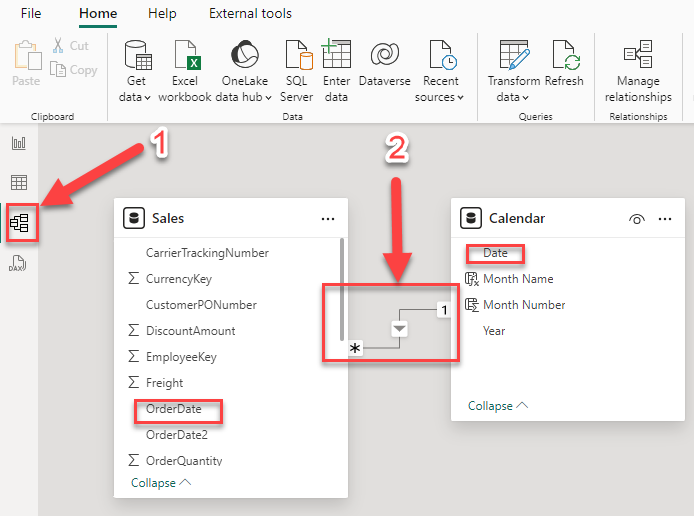
4. Data Model
(Skip this if you are working with 1 flat table only, and come back later)
As a beginner you may try to work at first with a limited flat table, or even for a quick report. As you become more knowledgeable and would like to scale your analytics solution, you will need to apply data modeling skills since Power BI works optimal when we create what it is called a Star Schema. You don’t need to worry about this right now, but I wanted to plant the seed with some terminology for your bright future. (I love teaching Data Modeling, be on the watch for my talks/trainings)
Working with Time Series will require a Date or Calendar Dimension table, which is like a lookup table that we use to slice our data. if you are bringing one or more of this tables, go and check the “Data Model” tab to make sure that you have the required relationship between tables in place, or create them from there.
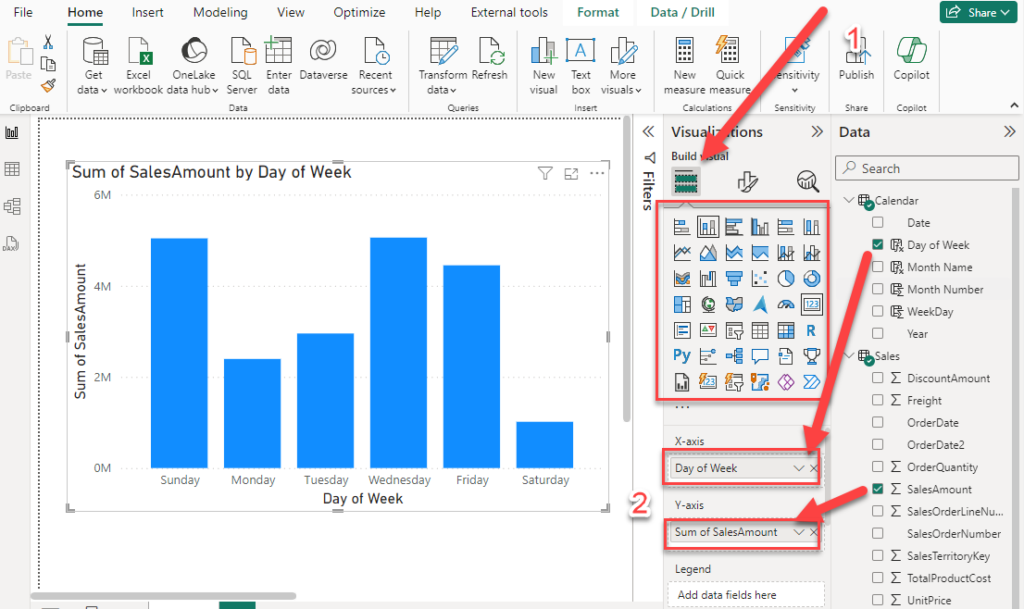
5. Create Stunning Visuals
After we are done shaping our data, we will use our Report Canvas and add elements, mainly visuals. Again, there are many ways to perform task, for this example, we are going to select from “Visualizations” options, a visual of our likes, I chose a bar chart, and assign the columns we wish, I chose to see my Sales Amount by the Day of Week.
As you experiment with this, you will find that each visual has its own formatting and analysis properties
Among other items that you can find are:
- bringing more visuals from the market place or even create your own. (click on the 3 dots under the default visuals to explore)
- objects such ass text boxes, buttons, images and shapes,
- Powerful AI infused visuals: Q&A for natural language, Decomposition Tree, Narrative, Key Influencers,
6. Save your Report and Share with Others.
Once you finished creating your Report, you can go to File and Select the option desired.
…
As shown below, you can “Save as” a “.pbix” file to your local computer, “Share” to your OneDrive, “Export” as a PDF or Power BI Template, or “Publish” to the Power BI Service.
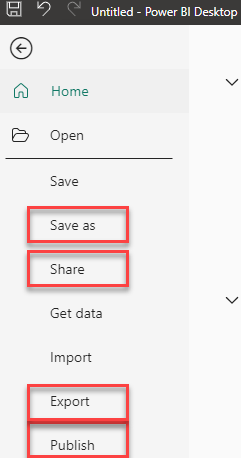
The first 3 options will demand that you share the report in a file with others, while the Publish to the Power BI Service option will enable the more advance options for sharing and collaborating (the latter requires paid licensing ). We will cover this in another article.
7. Keep an Always Learning Attitude for Success 😉
Power BI and its Analytics Ecosystem is an ever changing platform. The Microsoft Team is constantly working on new features which many of them come from listening to its users and customers. For that reason, you will see updates coming up on a monthly basis and sometimes even daily.
A good way to stay up to date is to follow us on LinkedIn here, watch the Official Power BI Blog Page, attend Meetups in the community, you can join ours on Meetup Portal, and Subscribe to our YouTube Channel for Video content and past recordings.
Thank you for reading, and Let me know how it goes !
-Cecilia Brusatori (LinkedIn / Twitter )
Training Options here.
Ready to Start Planning and Implement Power BI?